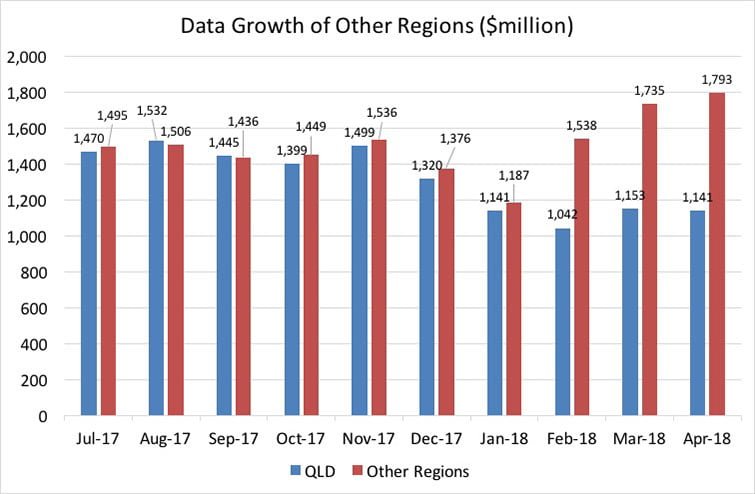
Members Data Continues to Grow for NSW and Other Regions
- Trading data for NSW provided by 158 members reached $942.10m in April 2018.
- Data for NSW has grown by 32% since July 2017.
- Total members debt value for April 2018 was $2.938b ($2,938, 375,784). With ‘Other Regions’ contributing $1.793b of this total.
Regions Report, April 2018 Data
Region – Number of members providing data in April 2018
| Region | Number of Members Reporting |
|---|---|
| Exclusive to No Location | 198 |
| Central Qld | 121 |
| Darling Downs | 113 |
| Gold Coast & Northern NSW | 179 |
| North QLD | >95 |
| NSW | 158 |
| Northern Territory | 51 |
| Sunshine Coast | 145 |
| Victoria/SA/TAS | 159 |
| WA | 91 |
Region Debtor Counts
Regions – Number of Trading Entities Reported per Month
| Regions | Feb-18 | Mar-18 | Apr-18 |
|---|---|---|---|
| New South Wales | 12420 | 12596 | 12759 |
| Northern Territory | 688 | 703 | 629 |
| Darling Downs | 1633 | 1650 | 1501 |
| Western Australia | 4895 | 4911 | 4771 |
| Sunshine Coast | 2587 | 2555 | 2523 |
| North Queensland | 2523 | 2554 | 2257 |
| Gold Coast/Northern NSW | 4628 | 4684 | 4569 |
| Central Queensland | 2599 | 2608 | 2526 |
| Exclusive to No Location | 9045 | 9146 | 9100 |
| Victoria/Tas/SA | 15517 | 15638 | 15516 |


