BICB National Construction Industry Insolvency Statistics – July-December, 2018
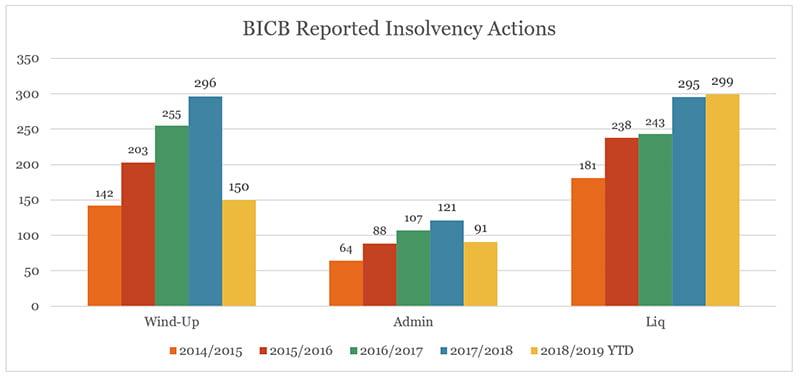
In the first 6 months of the current financial year, (July to December) BICB reported liquidations averaged 50 per month compared to 25 per month last year.
This is significantly higher, 100%, than last year. Growth in members data would account for some of this increase.