

CREDIT INSIGHTS
Construction Industry Insolvencies, What can we expect in 2021 and Beyond?

Key Points:
- Drop in Insolvencies
- What Will Happen in Construction Sector?
- Construction Insolvency Data
- Reading the Signs
- Impact of HomeBuilder
- Predictions for This Year
- Forecast for 2021/2022
Drop in Insolvencies
Unprecedented fiscal stimulus led to a drop in insolvencies in 2020, but the full picture may not emerge until the second half of 2021. The prevailing sentiment amongst insolvency specialists is that insolvency and restructuring work across a range of industry sectors is going to ramp up in the first half of this year (2021).
The following conditions support this sentiment: the cessation of Statutory relief for directors from liability for insolvent trading ceasing on December 31, 2020, together with thresholds for issuing and enforcing statutory demands reverting back to their usual levels, the rolling back of stimulus measures and the high probability the ATO will re-commence issuing statutory demands for delinquent tax debts from end of March this year.
What Will Happen in Construction Sector?
We decided to have a closer look to see if we could forecast what might happen in the construction sector over the next twelve months and beyond.
In compiling this report, we analysed latest Australian Securities and Investment Commission (ASIC) and Australian Financial Security Authority (AFSA) figures on business and personal insolvencies (released in January 2021) and the ABS Dwelling Approval Statistics. Our figures are based on historic data trends over the last ten years. However, they may only be a conservative estimate since 2020 was such an atypical year. The actual numbers could be higher.
In making these forecasts we also took the following factors into consideration –
- Historic insolvency numbers (6-year average)
- The removal of the Job Keeper programme from 28 March 2021.
- Domestic building stimulus measures.
- Current and historic Dwelling approvals.
- Suppliers ability to meet increased demand (antidotally).
- Cash-flow issues due to construction delays. (antidotally and BICB data trends).
- Price increases due to supply and demand pressures.
- Likelihood of lenders taking a harder line on businesses that have underperformed in recent years.
- Simplified debt restructuring and liquidation processes for businesses that have under AUD $1 million in liabilities.
What’s Happening Now?
Construction industry Insolvencies for April to December 2020 (9 months) were down by 49.36% on previous nine months, July 19 to March 20. That is 555 fewer insolvencies. So, in addition to normal monthly insolvency numbers from February 2021 and beyond there are potentially 555 so called, Zombie companies.
They would likely have failed if not for the Government’s Covid-19 stimulus measures. Once this ends on March 31, 2021, we believe it’s highly likely a significant number of these companies will fail over the next twelve months.

Construction Insolvency Data
The table below demonstrates how Covid-19 stimulus measures impacted on insolvency numbers from April last year. The data shows how far below the six year monthly average insolvencies fell during 2020. In April, construction insolvencies were 67.90% below the six-year monthly average. However, by December the fall was only 13.63%. Very surprisingly insolvencies for January 2021 were way lower than expected, in fact historically low. (Six-year average = 131 per month).
| Construction Insolvency Data | |||
|---|---|---|---|
| Per Mth Drop | Avg Fall | Total | |
| Apr-20 | 89 | 67.90% | 89 |
| May-20 | 58 | 44.20% | 147 |
| Jun-20 | 59 | 44.97% | 206 |
| Jul-20 | 65 | 49.55% | 270 |
| Aug-20 | 80 | 61.02% | 350 |
| Sep-20 | 67 | 51.08% | 417 |
| Oct-20 | 78 | 59.49% | 495 |
| Nov-20 | 42 | 31.97% | 537 |
| Dec-20 | 18 | 13.63% | 555 |
| Jan-21 | 101 | 77.07% | 655 |

Reading the Signs

Late last year there were clear signs insolvencies were rising. Construction industry insolvencies as a percentage of all insolvencies increased significantly in November and December 2020. Insolvencies for November and December were 59.55% higher on average than preceding seven months average, (April to October). That is a clear indication of insolvencies being on the increase. However, the extremely low January 2021 figures have been a big surprise. It is possible that the new restructuring regime may be impacting on these numbers.
Despite the low January numbers, our view is insolvencies will steadily increase during February/March and then more sharply from April/May 2021. (Table below, Construction as % of All insolvencies YTD).
ASIC Insolvency Summary for Construction Industry (Actual)
| Mth 20/21 | NSW | VIC | QLD | SA | WA | TAS | NT | ACT | AUST | % |
| Jul | 19 | 23 | 11 | 1 | 6 | 0 | 0 | 6 | 66 | 14.16% |
| Aug | 26 | 13 | 5 | 0 | 5 | 0 | 0 | 2 | 51 | 10.94% |
| Sep | 25 | 21 | 13 | 0 | 3 | 0 | 0 | 2 | 64 | 13.73% |
| Oct | 22 | 11 | 9 | 3 | 5 | 0 | 0 | 3 | 53 | 11.37% |
| Nov | 23 | 50 | 7 | 1 | 7 | 0 | 0 | 1 | 89 | 19.10% |
| Dec | 48 | 39 | 12 | 4 | 6 | 2 | 1 | 1 | 113 | 24.25% |
| Jan | 10 | 11 | 2 | 1 | 5 | 0 | 1 | 0 | 30 | 6.44% |
| Feb | 0 | 0.00% | ||||||||
| Mar | 0 | 0.00% | ||||||||
| Apr | 0 | 0.00% | ||||||||
| May | 0 | 0.00% | ||||||||
| Jun | 0 | 0.00% | ||||||||
| Total | 173 | 168 | 59 | 10 | 37 | 2 | 2 | 15 | 466 | 100.00% |

Impact of HomeBuilder
The introduction of the HomeBuilder programme has caused a surge in demand within the domestic building economy. HomeBuilder applications are the key driver of this activity, with around 82,000 applications received to January 31, 2021. Large and sudden increases in building activity are a catalyst for future financial stress.
Conditions for future failure are already beginning to appear, and many members are now advising their customers of substantial increases in lead times and prices. Supply and demand pressures are also causing material and labour shortages leading to construction delays. These pressures generally trigger cost blow-outs, which quickly lead to cash flow issues and ultimately, business failure.
See HomeBuilder statistics below
| Region | New Build | Renovation | Total | Reno % |
| NSW | 9270 | 5225 | 14495 | 36.05% |
| VIC | 18886 | 4445 | 23331 | 19.05% |
| QLD | 14789 | 3335 | 18124 | 18.40% |
| WA | 11913 | 894 | 12807 | 6.98% |
| SA | 6776 | 1640 | 8416 | 19.49% |
| TAS | 2014 | 383 | 2397 | 15.98% |
| ACT | 1499 | 552 | 2051 | 26.91% |
| NT | 266 | 30 | 296 | 10.14% |
| Total | 65413 | 16504 | 81917 | 20.15% |

Predictions for This Year
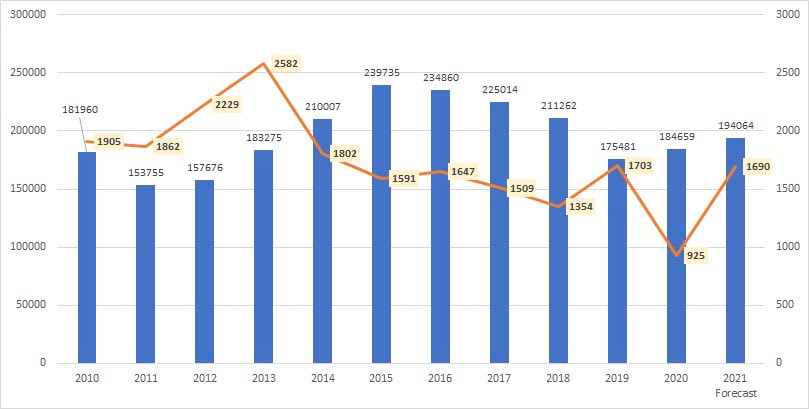
We forecast insolvencies for 2020/2021 financial year may reach 1,161. Of these, we think 725 (62.45%), will occur from January to June. For the full 2021 calendar year we forecast 1,690 business failures with 965 of these occurring from July to December. The five-year average for construction industry insolvencies is 1205.4. Calendar year insolvencies for 2020 (Jan to Dec) were 925. (Graph below compares dwelling approvals and Insolvencies)
| 2010 | 2011 | 2012 | 2013 | 2014 | 2015 | 2016 | 2017 | 2018 | 2019 | 2020 | 2021 Forecast | 2022 Forecast | |
| Dwelling Approvals | 181960 | 153755 | 157676 | 183275 | 210007 | 239735 | 234860 | 225014 | 211262 | 175481 | 184659 | 194064 | 176000 |
| Insolvency | 1905 | 1862 | 2229 | 2582 | 1802 | 1591 | 1647 | 1509 | 1354 | 1703 | 925 | 1690 | 2081 |
| Insol as % of App | 1.05% | 1.21% | 1.41% | 1.41% | 0.86% | 0.66% | 0.70% | 0.67% | 0.64% | 0.97% | 0.50% | 0.87% | 1.18% |
| Avg Cash Rate | 4.75% | 5.11% | 4.02% | 2.98% | 2.73% | 2.30% | 1.89% | 1.64% | 1.64% | 1.27% | 0.29% | 0.10% | 0.10% |
Insolvencies Construction Industry (Actual & Forecast)
| Mth 20/21 | NSW | VIC | QLD | SA | WA | TAS | NT | ACT | AUST |
| Jul | 19 | 23 | 11 | 1 | 6 | 0 | 0 | 6 | 66 |
| Aug | 26 | 13 | 5 | 0 | 5 | 0 | 0 | 2 | 51 |
| Sep | 25 | 21 | 13 | 0 | 3 | 0 | 0 | 2 | 64 |
| Oct | 22 | 11 | 9 | 3 | 5 | 0 | 0 | 3 | 53 |
| Nov | 23 | 50 | 7 | 1 | 7 | 0 | 0 | 1 | 89 |
| Dec | 48 | 39 | 12 | 4 | 6 | 2 | 1 | 1 | 113 |
| Jan | 10 | 11 | 2 | 1 | 5 | 0 | 1 | 0 | 30 |
| Feb | 36 | 31 | 18 | 3 | 9 | 0 | 1 | 2 | 101 |
| Mar | 55 | 47 | 27 | 5 | 14 | 1 | 1 | 3 | 153 |
| Apr | 45 | 39 | 23 | 4 | 12 | 0 | 1 | 3 | 127 |
| May | 58 | 50 | 29 | 5 | 15 | 1 | 1 | 4 | 163 |
| Jun | 54 | 46 | 27 | 5 | 14 | 1 | 1 | 3 | 151 |
| Total | 421 | 380 | 184 | 33 | 102 | 5 | 7 | 30 | 1161 |
Forecast 2021/2022

Predicting insolvencies in construction industry for 2021/2022 is much more difficult and arguably foolhardy to even try. Nonetheless we will attempt to forecast the future.
Historically, construction insolvencies are lower when building approvals are trending higher (see Graph). However, this may not hold true for 2021/2022.
Looking forward, we believe that insolvencies could be much higher in 2021/2022 despite the continued upward trend in housing approvals through to June 2021. We forecast there could be around 1,690 construction industry insolvencies in 2021 calendar year (1,161 FY). That’s an average of 141 per month. Because insolvencies tend to rise following a boom, our forecast for the 2021/2022 financial year is for 1,930 insolvencies. The largest percentage of these likely to occur between January to June 2022.


Managing Risk
Sound strategies and policies are essential elements for effectively managing risk. Key to this is access to meaningful, reliable, and accurate data; particularly data that tracks payment trends.
BICB members have access to the largest and most comprehensive building industry debtor database in Australia, with information on 180,000 plus debtor entities totalling around $30billion in annual trade.
As a member of Australia’s largest building industry trade bureau, you belong to a unique, and growing, supplier group, whose members are suppliers to the building and construction industry.


