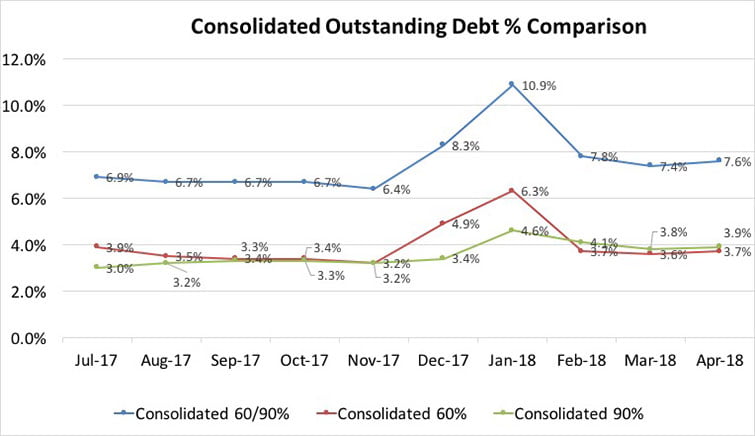
Consolidated Outstanding 60/90 Day Debt Percentage
Our data shows that the Consolidated 60/90 debt percentage for the first four months of 2018 is slightly higher than the first six months of the 2017/2018 financial year. It will be interesting to see if this trend continues.
Consolidated DSO Result
Days Sales Outstanding (DSO) represents the average number of days it takes credit sales to be converted into cash, or when a company’s account receivables can be collected. DSO can be calculated by dividing the total accounts receivable during a certain period of time by the total net credit sales.
BICB Consolidated DSO (Based on June, July, August data) = 63.48
| ASIC Insolvency Statistics | Avg Last 3yrs | Mar Qtr 2017 | Jun Qtr 2017 | Sep Qtr 2017 | Dec Qtr 2017 | Total 2017 | + or – 3 Yr Avg |
|---|---|---|---|---|---|---|---|
| Provisional wind-up | 1 | 0 | 0 | 0 | 0 | 0 | -1 |
| Court wind-up | 445 | 95 | 55 | 107 | 88 | 345 | -100 |
| Creditors wind-up | 813 | 198 | 140 | 208 | 168 | 714 | -99 |
| Receiver appointed | 8 | 0 | 0 | 2 | 0 | 2 | -6 |
| Controller (except receiver or managing controller) | 12 | 1 | 2 | 6 | 2 | 11 | -1 |
| Managing controller (except receiver & manager) | 1 | 1 | 0 | 0 | 0 | 1 | 0 |
| Receiver manager appointed | 40 | 6 | 5 | 4 | 3 | 18 | -22 |
| Scheme administrator appointed | 0 | 0 | 0 | 0 | 0 | 0 | 0 |
| Voluntary Administration | 203 | 54 | 25 | 60 | 42 | 181 | -22 |
| Foreign/RAB wind-up | 0 | 0 | 0 | 0 | 0 | 0 | 0 |
| Total | 1523 | 355 | 227 | 387 | 303 | 1272 | -251 |
| Avg per QTR | 381 |


