CREDIT INSIGHTS
How are Australia’s states and territories performing?

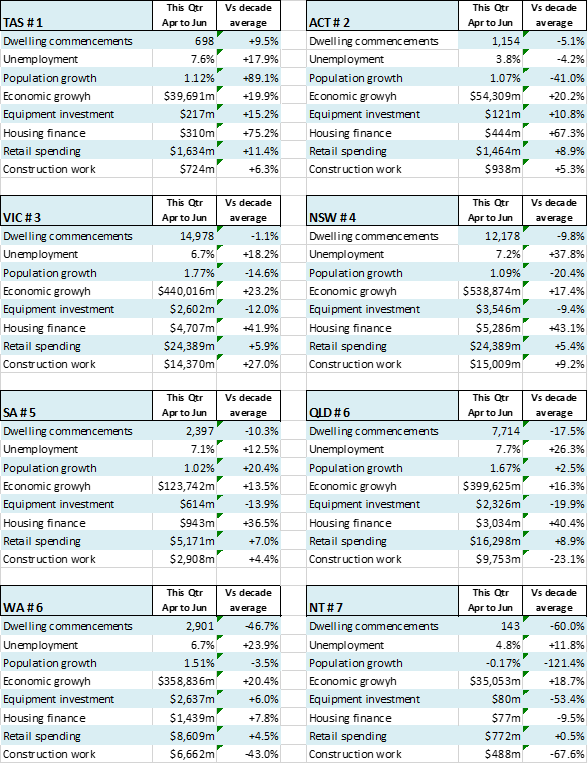
CommSec State of the States
Each quarter, CommSec attempts to find out by analysing eight key indicators: economic growth; retail spending; equipment investment; unemployment; construction work done; population growth; housing finance and dwelling commencements. Just as the Reserve Bank uses long-term averages to determine the level of “normal” interest rates; CommSec have done the same with the economic indicators. For each state and territory, latest readings for the key indicators were compared with decade averages – that is, against the “normal” performance.
Now in its 12th year, the State of the States report also includes a section comparing annual growth rates for the eight key indicators across the states and territories as well as Australia as a whole. This enables another point of comparison – in terms of economic momentum.
Annual Growth Rates
The State of the States report assesses economic performance by looking at the most recent result – such as retail trade or construction – and compares that with the ‘normal’ experience. And by ‘normal experience’, we define this as the decade average.
A resident of the state or territory can therefore assess whether they are experiencing relatively better economic times.
Comparing states or territories on the same criteria determines which state or territory is performing the best on a certain indicator. In addition to relative economic performance, some are also interested in economic momentum . That is, annual changes in key indicators. A state or territory may have been under-performing, but if annual growth is rising, then this suggests that the performance has scope to improve.
On the eight indicators assessed Western Australia tops the annual changes on three measures. Economic momentum is on its side. All the other economies except NSW and South Australia are on top for annual economic growth on one of five economic indicators.
When looking across growth rates for the states and territories, Western Australia exceeds the national-average on six of the eight indicators. Next best are Tasmania the ACT and Victoria (five), Queensland (four) and South Australia and Northern Territory (three). New South Wales outperformed the national average on two indicators.
| Economic Growth | Retail Trade | Equipment Investment | Employment | Construction Work | Population | Housing Finance | Dwelling Starts | |
| NSW | -1.7% | -4.3% | -17.1% | -2.4% | -8.9% | 1.09% | 10.5% | -12.6% |
| VIC | 1.6% | -6.2% | -22.4% | -5.8% | 6.2% | 1.77% | 15.8% | -1.8% |
| QLD | -0.5% | 1.5% | -16.1% | -1.5% | -0.4% | 1.67% | -4.5% | 0.5% |
| SA | 0.1% | -1.1% | -12.9% | -1.4% | -5.3% | 1.02% | -2.0% | 2.2% |
| WA | 7.7% | 3.3% | 5.9% | -0.3% | 7.8% | 1.57% | -9.8% | -30.3% |
| TAS | 3.3% | 2.5% | -1.8% | 0.4% | -8.1% | 1.12% | -8.6% | -4.3% |
| NT | 7.9% | 2.5% | -46.3% | -5.1% | -3.9% | -0.17% | -23.0% | -5.9% |
| ACT | 4.9% | -1.1% | 0.0% | -1.6% | 2.5% | 1.07% | 21.0% | -14.9% |
| AUST | 1.5% | 2.3% | -13.8% | -2.8% | -1.0% | 1.41% | 7.3% | -8.0% |
State of the States June Quarter (April to June 2020)
For the second quarter in a row, Tasmania holds the mantle of the best performing economy in its own right. But there have been notable changes in the other rankings. Victoria has dropped from second to third spot, behind the ACT. NSW shares equal fourth spot with South Australia. Then in joint sixth position are Queensland and Western Australia from the Northern Territory. Tasmania has now been on top for three straight surveys. The second ranking for the ACT is its highest ranking in just over three years. And the third ranking for Victoria is its lowest position in just over three years. South Australia is in joint fourth position – its highest ranking in three years. And the joint sixth position for Western Australia is its highest ranking since April 2016. Read the full CommSec State of the Sates report here.