Corporate Insolvency in the Building and Construction Industry – What’s Really Going On?
There has been a lot of media attention recently about the level of corporate insolvencies in the building industry. The media’s reporting on this subject could lead you to conclude that insolvency in the building industry is ‘out of control’. There is no denying that the construction industry has a disproportionately high level of insolvency (the industry accounts for 8 to 10% of GDP and 20 to 25% of all insolvencies), and yes, there has been a spate of high-profile business failures over the last few years and these failures have hurt a lot of subbies and suppliers alike.
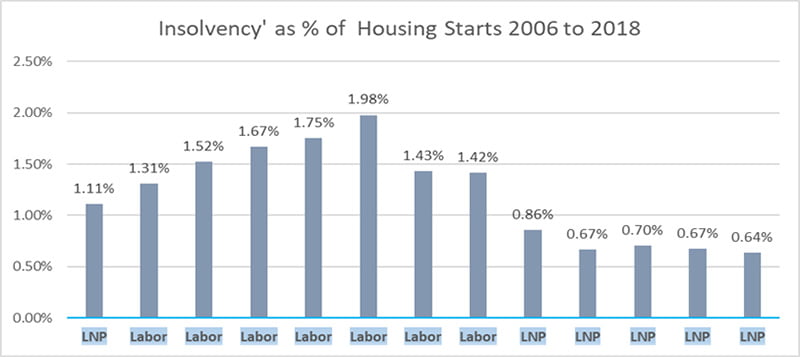
But is it out of control? We decided to investigate for ourselves. We discovered that instead of going up, insolvencies in the building and construction industry had fallen, both in number and as a percentage of activity. Since the peak of 1.98% in 2011 to July 2018, insolvency as a percentage of housing starts has been falling.
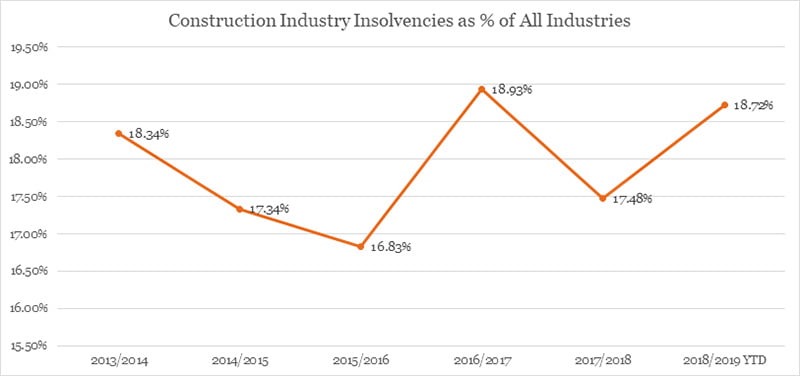
However, since August 2018 insolvencies in the construction sector have been trending upward. In the 2018/2019 FY to January 2019 insolvencies are up by 112 (14.72%) on the same period last year. Insolvencies for All Industries are also up by 306 (7.02%) for the same period. If this trend continues, we could finish up with 1,552 corporate insolvencies in the construction industry for the full 2018/2019 financial year.
The construction industry has a disproportionately high level of insolvency, the industry accounts for 8 to 10 percent of GDP and 20 to 25 percent of all insolvencies.
- In the five-year period 2009 to 2013, there were a total of 10,338 insolvencies, an average of 2,068 per year.
- In the five-year period 2014 to 2018, there were a total of 7,903 insolvencies, an average of 1,581 per year.
- In the last three years 2016 to 2018, there were a total of 4,510 insolvencies, an average of 1,503 per year.
- In 2018 there were 1,354 insolvencies.
- From July 2018 to January 2019 insolvencies were up by 112 (14.72%) on the same period last FY.
We looked at a number of other conditions, to see if these may have had any influence on the insolvency numbers. We looked at, home loan interest rates, who was in government Federally, GFC and GFC stimulus measures. We draw no conclusions about these, they are included out of curiosity only.
| National Insolvency Statistics Comparison by STATE 2018/2019 YTD | ||||||||||
|---|---|---|---|---|---|---|---|---|---|---|
| Summary | NSW | VIC | QLD | SA | WA | TAS | NT | ACT | AUST | % |
| All Industries | 1532 | 1316 | 966 | 186 | 520 | 28 | 31 | 84 | 4663 | |
| % | 32.85% | 28.22% | 20.72% | 3.99% | 11.15% | 0.60% | 0.66% | 1.80% | 100.00% | |
| Construction | 294 | 229 | 169 | 28 | 118 | 5 | 8 | 22 | 873 | 18.72% |
| % | 33.68% | 26.23% | 19.36% | 3.21% | 13.52% | 0.57% | 0.92% | 2.52% | 100.00% | |
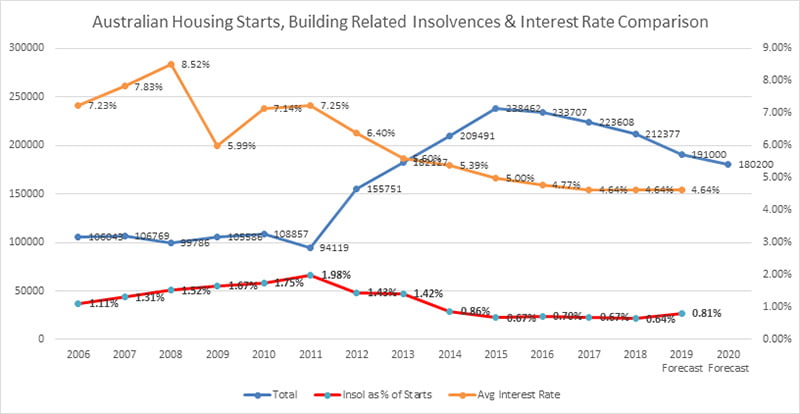
The ABS data for residential and non-residential construction work during the 2009/10 and 2010/11 financial years shows the stark effect of the Commonwealth Government’s financial stimulus package implemented in response to the ‘Global Financial Crisis’. In 2008/09 the residential and non-residential proportion of public expenditure in the construction industry was 2.1 and 19.5 per cent respectively. In 2009/10 this rose to 8.3 per cent in the residential sector and 37.4 per cent for the non-residential sector and in 2010/11 remained high at 7.9 per cent and 32.6 per cent.
What we found interesting was that insolvency numbers increased during 2009 and 2010 and in 2011, insolvency as a % of housing starts peaked at 1.98%. Is there a correlation? We don’t know.
| Insolvencies expressed as a % of Housing Starts | ||||||||||||
| 2006 | 2007 | 2008 | 2009 | 2010 | 2011 | 2012 | 2013 | 2014 | 2015 | 2016 | 2017 | 2018 |
|---|---|---|---|---|---|---|---|---|---|---|---|---|
| LNP | Labor | Labor | Labor | Labor | Labor | Labor | Labor | LNP | LNP | LNP | LNP | LNP |
| 1.11% | 1.31% | 1.52% | 1.67% | 1.75% | 1.98% | 1.43% | 1.42% | 0.86% | 0.67% | 0.70% | 0.67% | 0.64% |
This is the first in a series of articles on insolvency in the building and construction industry in Australia. Subsequent articles will feature in our Newsletters over the next few months.
